China Monthly NEV Sales (Exports Included) 2024-2026
| Month |
2024 |
2025 |
2026 |
| January |
729,000 |
944,000 |
945,000 |
| February |
477,000 |
892,000 |
765,000 |
| March |
883,000 |
1,237,000 |
1,252,000 |
| April |
850,000 |
1,226,000 |
1,344,000 |
| May |
955,000 |
1,307,000 |
1,496,000 |
| June |
1,049,000 |
1,329,000 |
1,643,000 |
| July |
991,000 |
1,262,000 |
1,561,000 |
| August |
1,100,000 |
1,395,000 |
1,643,000 |
| September |
1,287,000 |
1,604,000 |
|
| October |
1,430,000 |
1,715,000 |
|
| November |
1,512,000 |
1,823,000 |
|
| December |
1,596,000 |
1,710,000 |
|
China monthly NEV sales (exports included)
2024
2025
2026
- China's BEV sales rose 27.8% in August, while PHEV sales fell 0.9%.
- NEV exports rose about 130% year-on-year, offsetting a decline in domestic sales.
China's new energy vehicle (NEV) sales rose 17.8% year-on-year in August, accounting for a record share of total new vehicle sales as exports continued to offset domestic market weakness.
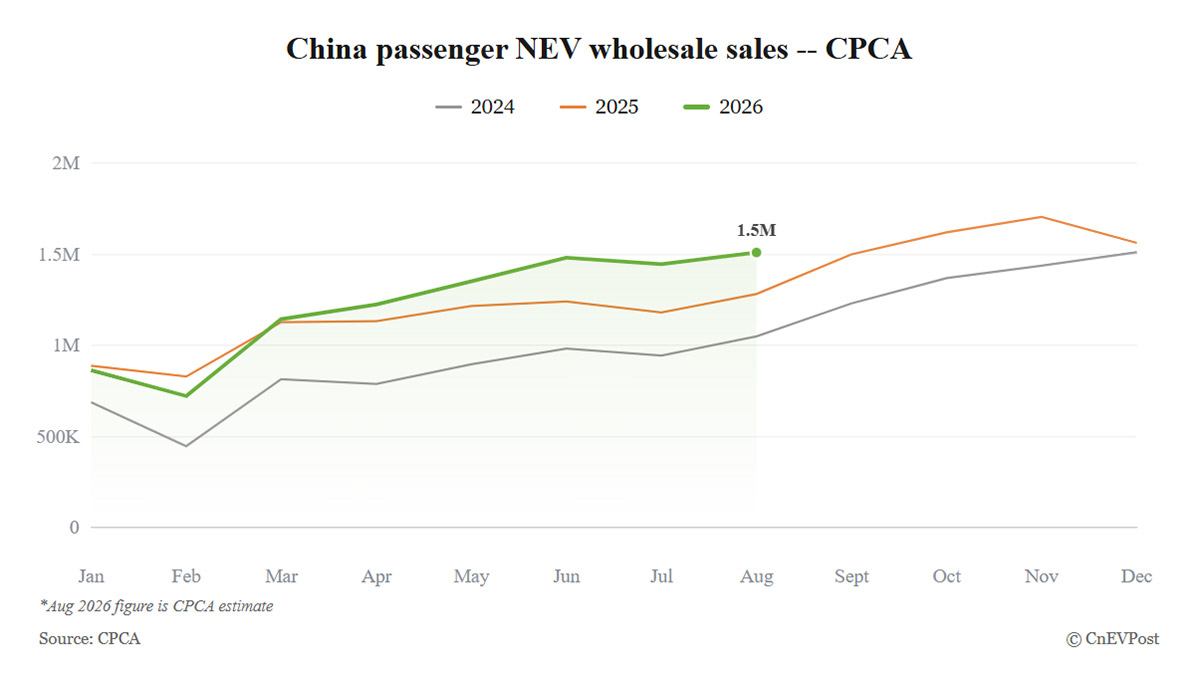
NEV sales totaled 1.643 million in August, including domestic sales and exports, according to a report released Thursday by the China Association of Automobile Manufacturers (CAAM).
That was up 5.3% from July, matching the year's high set in June, although year-on-year growth slowed from July's 23.7%, according to data compiled by CnEVPost.
NEVs accounted for 60.6% of total vehicle sales, up from 60.4% in July and 48.8% a year earlier, exceeding 60% for the second consecutive month.
China Monthly NEV Penetration 2024-2026
| Month |
2024 |
2025 |
2026 |
| January |
29.9% |
39% |
40.3% |
| February |
30.1% |
41.9% |
42.4% |
| March |
32.8% |
42.4% |
43.2% |
| April |
36% |
47.3% |
53.2% |
| May |
39.5% |
48.7% |
56.9% |
| June |
41.1% |
45.8% |
58.5% |
| July |
43.8% |
48.7% |
60.4% |
| August |
44.8% |
48.8% |
60.6% |
| September |
45.8% |
49% |
|
| October |
46.8% |
51.6% |
|
| November |
45.6% |
53.2% |
|
| December |
45.7% |
52.3% |
|
China monthly NEV penetration
2024
2025
2026
CAAM's NEV wholesale figures cover passenger and commercial vehicles, including battery electric vehicles (BEVs), plug-in hybrid electric vehicles (PHEVs) and fuel-cell vehicles.
BEVs continued to lead growth. Sales reached 1.161 million in August, up 27.8% year-on-year and 8.3% month-on-month, setting a new high for the year.
China Monthly BEV Sales 2024-2026
| Month |
2024 |
2025 |
2026 |
| January |
445,000 |
574,000 |
597,000 |
| February |
294,000 |
544,000 |
484,000 |
| March |
566,000 |
806,000 |
831,000 |
| April |
519,000 |
822,000 |
905,000 |
| May |
583,000 |
834,000 |
1,026,000 |
| June |
612,000 |
859,000 |
1,142,000 |
| July |
551,000 |
811,000 |
1,072,000 |
| August |
646,000 |
908,000 |
1,161,000 |
| September |
775,000 |
1,058,000 |
|
| October |
842,000 |
1,109,000 |
|
| November |
908,000 |
1,170,000 |
|
| December |
973,000 |
1,108,000 |
|
China monthly BEV sales
2024
2025
2026
By contrast, PHEV sales totaled 482,000, down 0.9% year-on-year and 1.4% month-on-month, returning to decline after 2 consecutive months of year-on-year growth.
China Monthly PHEV Sales 2024-2026
| Month |
2024 |
2025 |
2026 |
| January |
284,000 |
370,000 |
348,000 |
| February |
183,000 |
348,000 |
280,000 |
| March |
317,000 |
431,000 |
421,000 |
| April |
331,000 |
403,000 |
439,000 |
| May |
371,000 |
473,000 |
470,000 |
| June |
436,000 |
470,000 |
500,000 |
| July |
438,000 |
451,000 |
489,000 |
| August |
453,000 |
487,000 |
482,000 |
| September |
511,000 |
546,000 |
|
| October |
587,000 |
605,000 |
|
| November |
604,000 |
652,000 |
|
| December |
622,000 |
599,000 |
|
China monthly PHEV sales
2024
2025
2026
NEV production reached 1.653 million in August, up 18.9% year-on-year. Cumulative NEV sales in the first 8 months totaled 10.65 million, up 10.7%, accounting for 52.4% of total vehicle sales.
China Monthly NEV Production 2024-2026
| Month |
2024 |
2025 |
2026 |
| January |
787,000 |
1,015,000 |
1,041,000 |
| February |
464,000 |
888,000 |
694,000 |
| March |
863,000 |
1,277,000 |
1,231,000 |
| April |
870,000 |
1,251,000 |
1,320,000 |
| May |
940,000 |
1,270,000 |
1,554,000 |
| June |
1,003,000 |
1,268,000 |
1,598,000 |
| July |
984,000 |
1,243,000 |
1,576,000 |
| August |
1,092,000 |
1,391,000 |
1,653,000 |
| September |
1,307,000 |
1,617,000 |
|
| October |
1,463,000 |
1,772,000 |
|
| November |
1,566,000 |
1,880,000 |
|
| December |
1,530,000 |
1,718,000 |
|
China monthly NEV production
2024
2025
2026
Exports and domestic sales continued to diverge. NEV exports reached 526,000 in August, up about 130% year-on-year, despite falling 5% from July.
China Monthly NEV Exports 2024-2026
| Month |
2024 |
2025 |
2026 |
| January |
101,000 |
150,000 |
302,000 |
| February |
82,000 |
131,000 |
282,000 |
| March |
124,000 |
158,000 |
371,000 |
| April |
114,000 |
200,000 |
430,000 |
| May |
99,000 |
212,000 |
446,000 |
| June |
86,000 |
205,000 |
523,000 |
| July |
103,000 |
225,000 |
553,000 |
| August |
110,000 |
224,000 |
526,000 |
| September |
111,000 |
222,000 |
|
| October |
128,000 |
256,000 |
|
| November |
83,000 |
300,000 |
|
| December |
134,000 |
300,000 |
|
China monthly NEV exports
2024
2025
2026
NEVs accounted for about 52.1% of total vehicle exports during the month, exceeding half for the third consecutive month. Cumulative NEV exports in the first 8 months reached 3.435 million, up 124.3% year-on-year.
Domestic NEV sales totaled 1.118 million in August, down 4.6% year-on-year but up 10.9% month-on-month. In the first 8 months of the year, domestic NEV sales totaled 7.215 million, down 10.8% year-on-year.
China Monthly NEV Sales (Excluding Exports) 2024-2026
| Month |
2024 |
2025 |
2026 |
| January |
629,000 |
793,000 |
643,000 |
| February |
395,000 |
760,000 |
483,000 |
| March |
758,000 |
1,079,000 |
882,000 |
| April |
736,000 |
1,025,000 |
914,000 |
| May |
856,000 |
1,095,000 |
1,049,000 |
| June |
963,000 |
1,124,000 |
1,120,000 |
| July |
887,000 |
1,037,000 |
1,008,000 |
| August |
990,000 |
1,171,000 |
1,118,000 |
| September |
1,176,000 |
1,382,000 |
|
| October |
1,302,000 |
1,459,000 |
|
| November |
1,429,000 |
1,522,000 |
|
| December |
1,463,000 |
1,410,000 |
|
China NEV sales excluding exports
2024
2025
2026
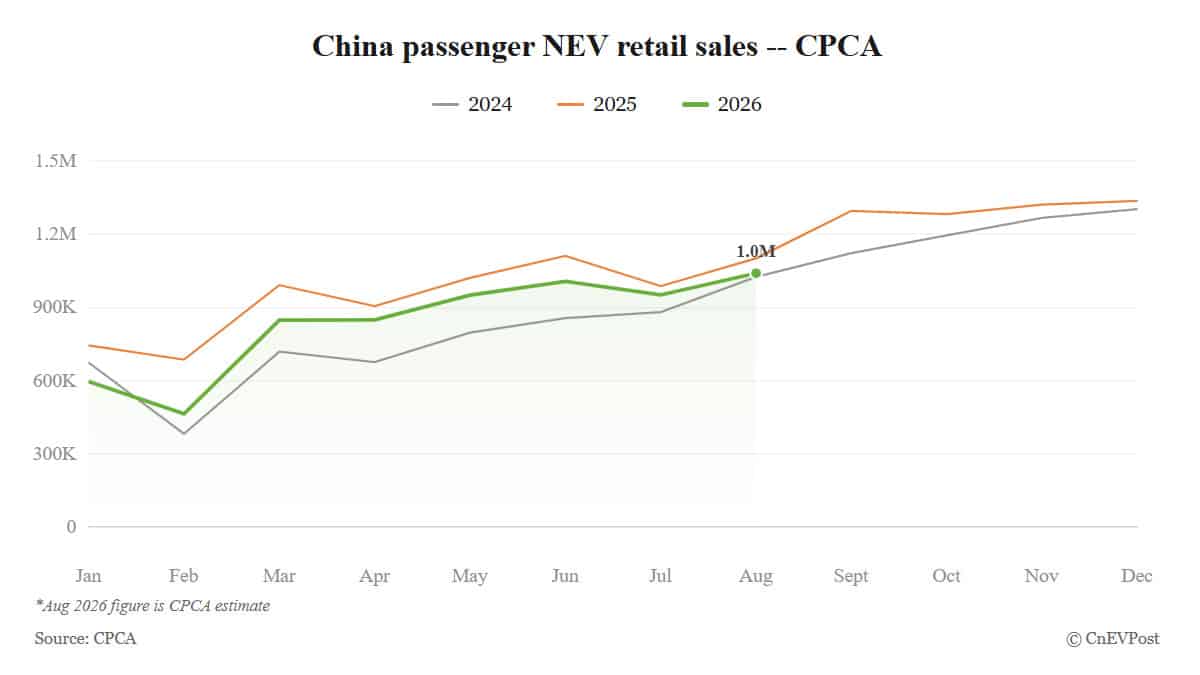
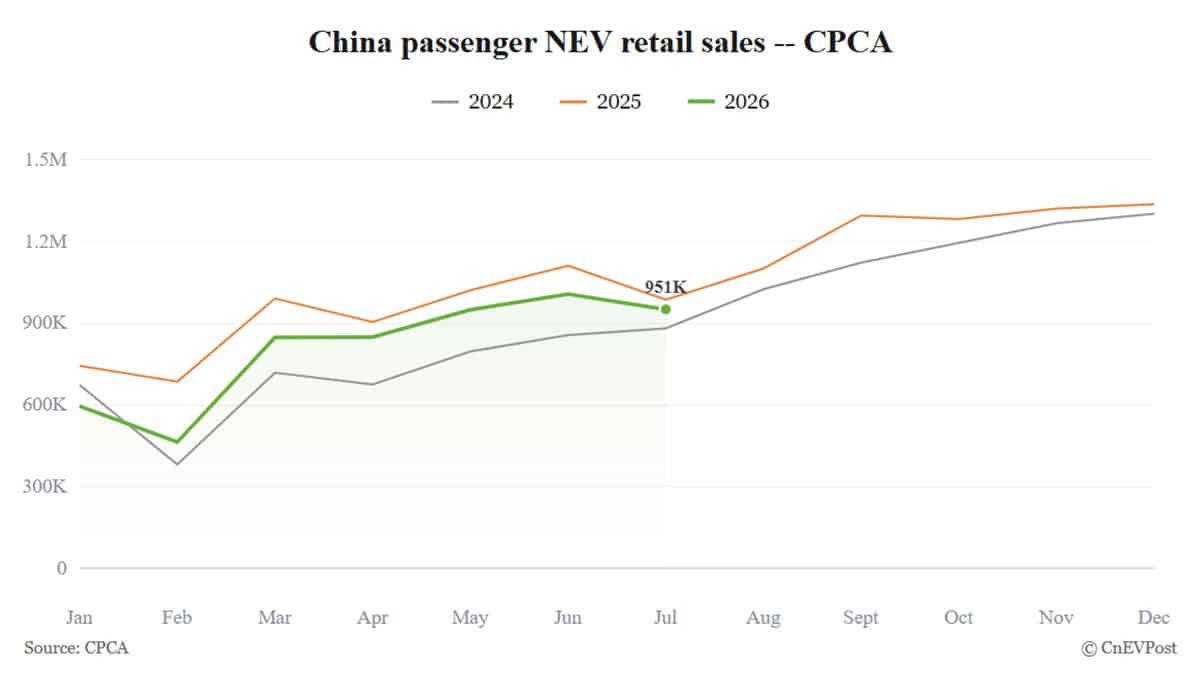
Domestic passenger NEV sales totaled 1.015 million in August, down 8.2% year-on-year, while commercial NEV sales rose 56.6% to 103,000.
The broader auto market remained under pressure. Total vehicle sales came in at 2.712 million in August, down 5.1% year-on-year but up 4.9% month-on-month.
China Monthly Car Sales 2024-2026
| Month |
2024 |
2025 |
2026 |
| January |
2,439,000 |
2,423,000 |
2,346,000 |
| February |
1,584,000 |
2,129,000 |
1,805,000 |
| March |
2,694,000 |
2,915,000 |
2,899,000 |
| April |
2,359,000 |
2,590,000 |
2,526,000 |
| May |
2,417,000 |
2,686,000 |
2,629,000 |
| June |
2,552,000 |
2,904,000 |
2,810,000 |
| July |
2,262,000 |
2,593,000 |
2,584,000 |
| August |
2,453,000 |
2,857,000 |
2,712,000 |
| September |
2,809,000 |
3,276,000 |
|
| October |
3,053,000 |
3,322,000 |
|
| November |
3,316,000 |
3,429,000 |
|
| December |
3,489,000 |
3,272,000 |
|
China monthly car sales
2024
2025
2026
CAAM said expanded vehicle purchase subsidies across multiple regions and active promotional campaigns by automakers helped drive the monthly recovery in vehicle production and sales.
However, domestic vehicle sales fell 24.2% year-on-year to 1.701 million in August, marking the fifth consecutive month with a decline exceeding 20%. Domestic sales of conventional fuel-powered vehicles fell 45.7% to 584,000.
Against that backdrop, NEVs accounted for 65.7% of domestic vehicle sales, further underscoring the contraction in the conventional fuel-powered vehicle market.
Exports continued to support the industry's overall sales. China exported 1.01 million vehicles in August, up 65.3% year-on-year and exceeding 1 million for the third consecutive month, although shipments fell 3.2% from July.
In the first 8 months of the year, China's vehicle exports totaled 7.153 million, up 66.7% year-on-year, while total vehicle sales fell 3.8% to 20.315 million.
Tesla returned to sixth place with a 5.0% share, while Leapmotor retained third place and posted the fastest year-on-year growth among the top 10.