What to Know About china battery installations rise 32% in June, LFP share hits record 83.3%
2024
2025
2026
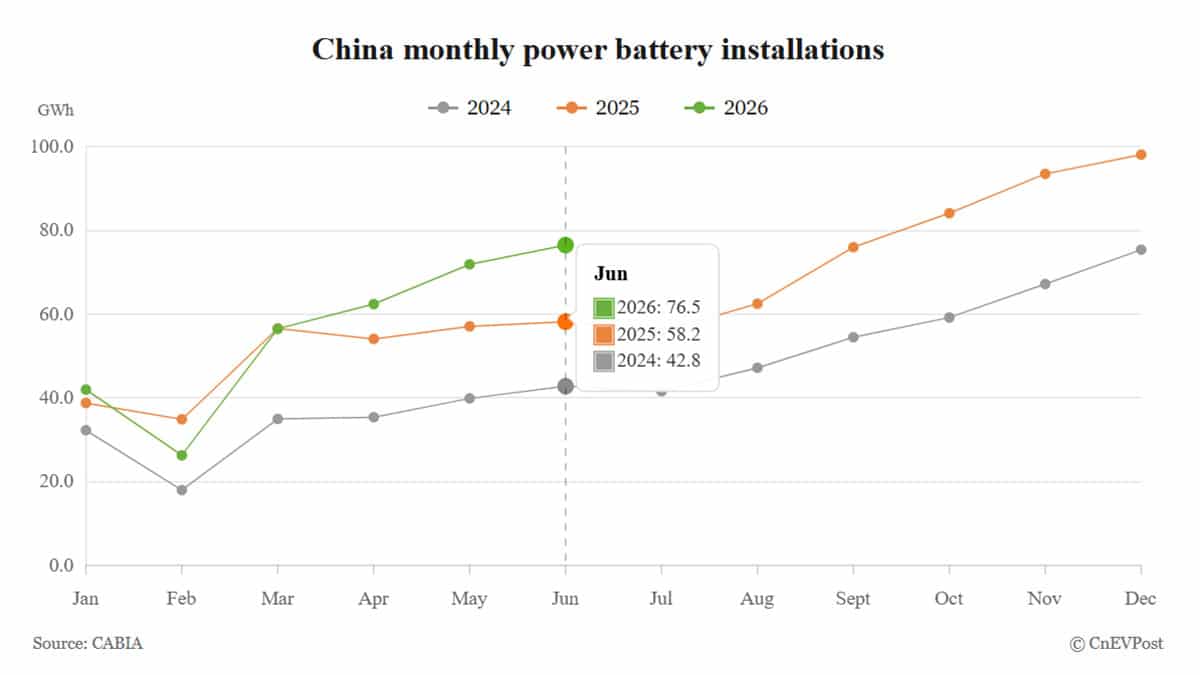
- China's power battery installations reached 76.5 GWh in June, up 31.5% year-on-year, the fastest growth so far this year.
- China exported a combined 36.2 GWh of power and energy storage batteries in June, up 48.7% year-on-year.
China's power battery installations accelerated in June, with lithium iron phosphate (LFP) batteries further extending their dominance as the electric vehicle market continues shifting toward lower-cost battery technology.
Domestic power battery installations reached 76.5 GWh in June, up 31.5% year-on-year and up 6.4% from May, according to data released Thursday by the China Automotive Battery Innovation Alliance (CABIA).
The year-on-year growth was faster than the 25.9% recorded in May and marked the strongest pace so far this year. China's power battery installations have now increased year-on-year for a third consecutive month and month-on-month for a fourth straight month.
The performance indicates that power battery demand has moved well beyond the seasonal weakness seen at the start of the year. Installations fell 24.6% and 0.2% year-on-year in February and March, respectively, due to the Chinese New Year holiday and a seasonal slowdown in vehicle sales.
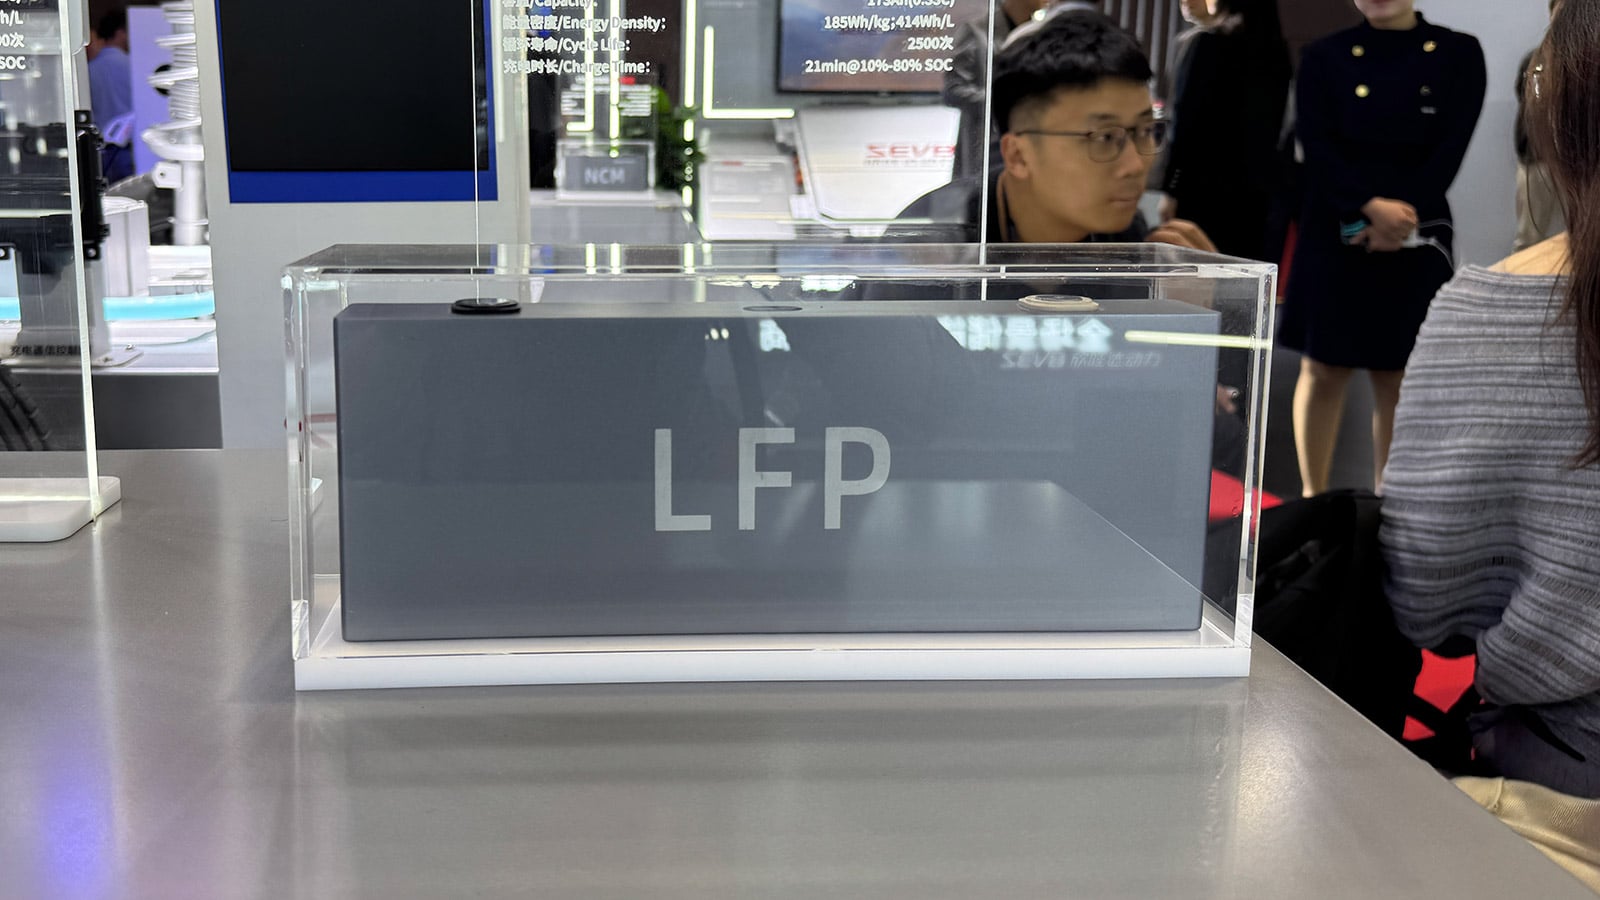
LFP batteries continued to drive overall market growth. Installations of LFP batteries reached 63.7 GWh in June, up 34.4% year-on-year and up 9.2% from May.
LFP
Ternary
| Month | Ternary (GWh) | LFP (GWh) |
|---|---|---|
| Jan 2020 | 1.6 | 0.7 |
| Feb 2020 | 0.5 | 0.1 |
| Mar 2020 | 2.2 | 0.5 |
| Apr 2020 | 2.6 | 0.9 |
| May 2020 | 2.7 | 0.8 |
| Jun 2020 | 3.0 | 1.7 |
| Jul 2020 | 3.3 | 1.7 |
| Aug 2020 | 3.5 | 1.6 |
| Sep 2020 | 4.2 | 2.3 |
| Oct 2020 | 3.4 | 2.4 |
| Nov 2020 | 5.9 | 4.7 |
| Dec 2020 | 6.0 | 6.9 |
| Jan 2021 | 5.4 | 3.3 |
| Feb 2021 | 3.3 | 2.2 |
| Mar 2021 | 5.1 | 3.9 |
| Apr 2021 | 5.2 | 3.2 |
| May 2021 | 5.2 | 4.5 |
| Jun 2021 | 5.9 | 5.1 |
| Jul 2021 | 5.5 | 5.8 |
| Aug 2021 | 5.3 | 7.2 |
| Sep 2021 | 6.1 | 9.5 |
| Oct 2021 | 7.0 | 8.4 |
| Nov 2021 | 9.2 | 11.6 |
| Dec 2021 | 11.1 | 15.1 |
| Jan 2022 | 7.3 | 8.9 |
| Feb 2022 | 5.8 | 7.8 |
| Mar 2022 | 8.2 | 13.2 |
| Apr 2022 | 4.4 | 8.9 |
| May 2022 | 8.3 | 10.2 |
| Jun 2022 | 11.6 | 15.4 |
| Jul 2022 | 9.8 | 14.3 |
| Aug 2022 | 10.5 | 17.2 |
| Sep 2022 | 11.2 | 20.4 |
| Oct 2022 | 10.8 | 19.7 |
| Nov 2022 | 11.0 | 23.1 |
| Dec 2022 | 11.4 | 24.7 |
| Jan 2023 | 5.4 | 10.7 |
| Feb 2023 | 6.7 | 15.2 |
| Mar 2023 | 8.7 | 19.0 |
| Apr 2023 | 8.0 | 17.1 |
| May 2023 | 9.0 | 19.2 |
| Jun 2023 | 10.1 | 22.7 |
| Jul 2023 | 10.6 | 21.7 |
| Aug 2023 | 10.8 | 24.1 |
| Sep 2023 | 12.2 | 24.2 |
| Oct 2023 | 12.3 | 26.8 |
| Nov 2023 | 15.7 | 29.1 |
| Dec 2023 | 16.6 | 31.3 |
| Jan 2024 | 12.6 | 19.7 |
| Feb 2024 | 6.9 | 11.0 |
| Mar 2024 | 11.3 | 23.6 |
| Apr 2024 | 9.9 | 25.5 |
| May 2024 | 10.4 | 29.5 |
| Jun 2024 | 11.1 | 31.7 |
| Jul 2024 | 11.4 | 30.1 |
| Aug 2024 | 12.1 | 35.0 |
| Sep 2024 | 13.1 | 41.3 |
| Oct 2024 | 12.2 | 47.0 |
| Nov 2024 | 13.6 | 53.6 |
| Dec 2024 | 14.3 | 61.0 |
| Jan 2025 | 8.5 | 30.2 |
| Feb 2025 | 6.4 | 28.4 |
| Mar 2025 | 10.0 | 46.6 |
| Apr 2025 | 9.3 | 44.8 |
| May 2025 | 10.5 | 46.5 |
| Jun 2025 | 10.7 | 47.4 |
| Jul 2025 | 10.9 | 44.9 |
| Aug 2025 | 10.9 | 51.6 |
| Sep 2025 | 13.8 | 62.2 |
| Oct 2025 | 16.5 | 67.5 |
| Nov 2025 | 18.2 | 75.3 |
| Dec 2025 | 18.2 | 79.8 |
| Jan 2026 | 9.4 | 32.7 |
| Feb 2026 | 5.7 | 20.6 |
| Mar 2026 | 10.7 | 45.8 |
| Apr 2026 | 11.5 | 50.8 |
| May 2026 | 13.4 | 58.4 |
| Jun 2026 | 12.7 | 63.7 |
LFP batteries accounted for a record 83.3% of total power battery installations during the month. That was up 2.1 percentage points from 81.2% in May, further consolidating the technology's dominance in the Chinese market.
By comparison, ternary battery installations reached 12.7 GWh in June, up 18.1% year-on-year but down 5.5% from the previous month. Their market share fell to 16.5% from 18.6% in May.
The divergent month-on-month performance of the 2 battery types shows that automakers continue to accelerate their adoption of LFP technology, which is relatively cheaper and considered safer, despite typically offering lower energy density.
In the first 6 months of the year, China's cumulative power battery installations reached 335.6 GWh, up 12.0% year-on-year. The growth rate accelerated significantly from 7.3% in the first 5 months.
LFP battery installations totaled 272.0 GWh during the period, accounting for 81.0% of the total and rising 11.5% year-on-year. Ternary battery installations reached 63.4 GWh, representing an 18.9% share and increasing 14.2%.
Although cumulative growth in ternary battery installations was slightly faster than that of LFP batteries, their volume remained far lower. The monthly data also showed that ternary batteries continued to lose market share.
Production of power and energy storage batteries grew much faster than domestic vehicle installation demand. Combined output of the 2 battery categories reached 206.0 GWh in June, up 59.5% year-on-year and 7.5% month-on-month.
| Month | 2024 | 2025 | 2026 |
|---|---|---|---|
| Jan | 65.2 | 107.8 | 168 |
| Feb | 43.6 | 100.3 | 141.6 |
| Mar | 75.8 | 118.3 | 177.7 |
| Apr | 78.2 | 118.2 | 183.9 |
| May | 82.7 | 123.5 | 191.7 |
| Jun | 84.5 | 129.2 | 206 |
| Jul | 91.8 | 133.8 | |
| Aug | 101.3 | 139.6 | |
| Sept | 111.3 | 151.2 | |
| Oct | 113.1 | 170.6 | |
| Nov | 117.8 | 176.3 | |
| Dec | 124.5 | 201.7 |
In the first 6 months, cumulative production of power and energy storage batteries reached 1,068.9 GWh, up 53.3% year-on-year, far exceeding the 12.0% growth in domestic power battery installations during the same period.
The gap shows that additional output from China's battery industry is not being absorbed solely by the domestic EV market. Rapidly expanding energy storage demand and rising exports are becoming increasingly important sources of growth for battery manufacturers.
Combined sales of power and energy storage batteries reached 196.0 GWh in June, up 49.1% year-on-year and up 7.6% from May.
Power battery sales totaled 133.4 GWh, accounting for 68.1% of the total and rising 41.8% year-on-year. Energy storage battery sales reached 62.6 GWh, representing a 31.9% share and increasing 67.5%.
Energy storage battery sales grew significantly faster than power battery sales and rose 13.4% from May. This reflects how demand from grid-scale storage and renewable energy projects is increasing the importance of energy storage batteries within the industry.
In the first 6 months, cumulative sales of power and energy storage batteries reached 979.4 GWh, up 48.6% year-on-year. Power battery sales rose 36.2% to 661.3 GWh, while energy storage battery sales surged 83.4% to 318.1 GWh.
Exports also returned to strong month-on-month growth in June. Combined exports of power and energy storage batteries reached 36.2 GWh, up 48.7% year-on-year and up 23.7% from the previous month, accounting for 18.5% of total sales during the month.
2024
2025
2026
Power battery exports reached 25.5 GWh, up 60.8% year-on-year and up 26.6% month-on-month.
2024
2025
2026
Energy storage battery exports totaled 10.7 GWh, up 26.1% year-on-year and up 17.3% from May.
2024
2025
2026
China's combined exports of power and energy storage batteries had previously declined month-on-month for 2 consecutive months. The rebound in June indicates that overseas demand is again providing stronger growth support for Chinese battery manufacturers.
In the first 6 months, China exported a cumulative 181.3 GWh of power and energy storage batteries, up 42.5% year-on-year and accounting for 18.5% of total sales during the period.
Power battery exports totaled 122.7 GWh in the first half, up 50.3% year-on-year. Energy storage battery exports reached 58.6 GWh, an increase of 28.5%.
The recovery in domestic installations, rapid growth in energy storage battery sales and rebound in exports helped China's battery industry maintain strong growth in June.
However, production continues to expand faster than sales and installation demand, highlighting the need for the industry to monitor pressure on prices and capacity utilization as supply grows.